
Ray Stern

Audio By Carbonatix
Call it a silver lining.
Levels of nitrogen dioxide, a pollutant produced by burning fossil fuels, have fallen visibly in the air over Phoenix and surrounding cities during the coronavirus shutdown, preliminary data from the Maricopa Association of Governments shows.
Stay-at-home orders and social distancing guidelines are shuttering restaurants, movie theaters, and other businesses, costing people their jobs, stirring them crazy in their homes, and choking out the economy across the U.S. and around the world.
On the bright side, in this unprecedented, accidental experiment in emissions reduction, the air is cleaner with less human activity in Italy, China, and beyond.
You can see the difference in the Valley’s air in the maps produced by MAG and embedded below.
Although the Valley does not have excessive levels of nitrogen dioxide itself, the chemical is a precursor to ozone, an ingredient in smog and the source of serious air quality problems in Maricopa County. It is formed when nitrogen oxides, including nitrogen dioxide, react in sunlight with volatile organic compounds, or VOCs. Experts are hopeful that the decline in nitrogen dioxide levels will produce less ozone as the Valley’s summer air pollution season gets underway, although that remains to be seen.
The map on the left shows the first three weeks of March 2019. On the right, the first three weeks of March 2020. The more intense the magenta, the greater the concentration of nitrogen dioxide.
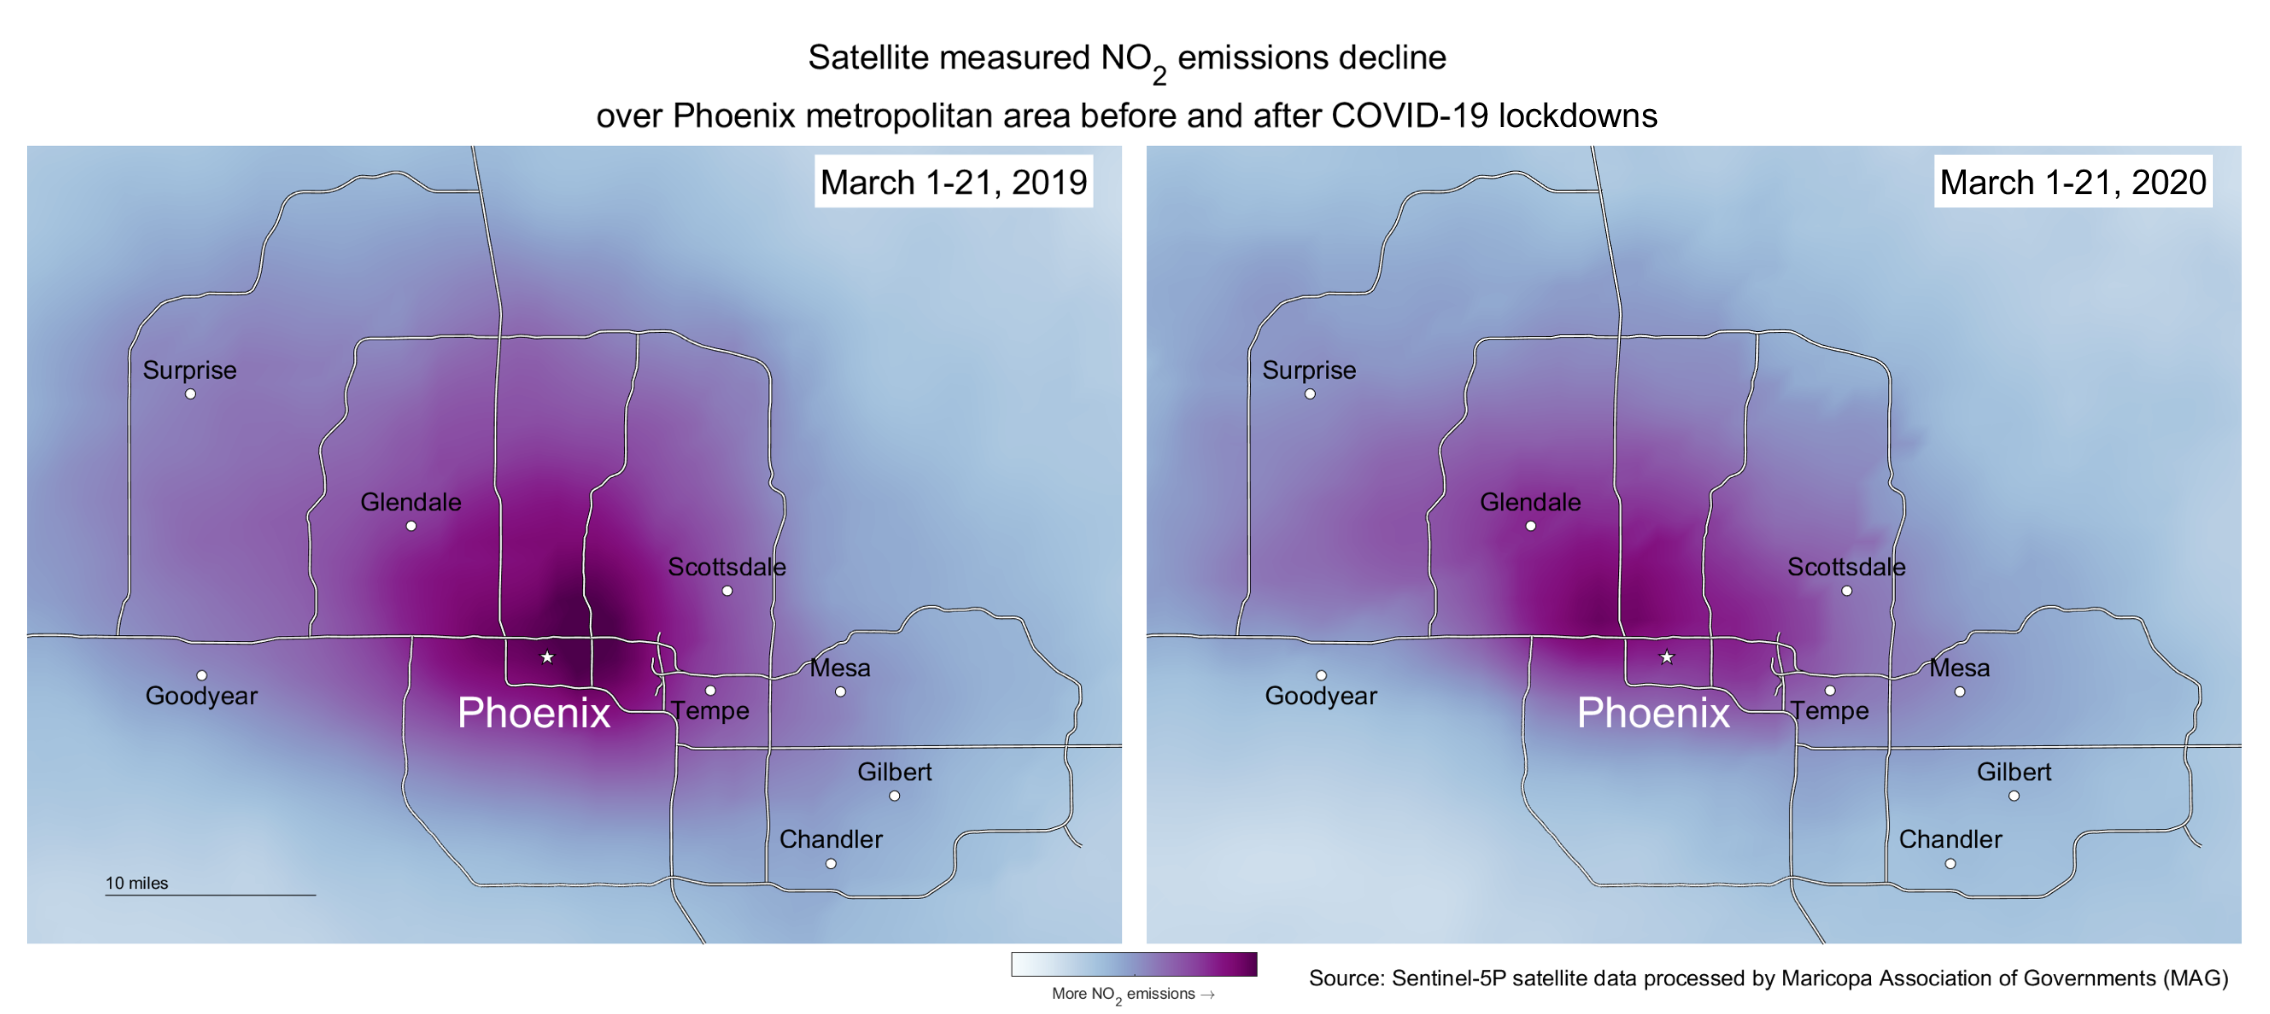
A comparison of average nitrogen dioxide emissions in March 2019, left, and March 2020.
Maricopa Association of Governments
Pretty cool.
A few caveats, though.
These maps are based on broad swaths of data from satellites that capture the density of nitrogen dioxide in a column of air 6.2 miles high – not at ground level.
The maps represent the average density of nitrogen dioxide over a three-week period. On any single day, the picture would be different. Data from far more localized sources – ground-level monitors from the Maricopa County Air Quality Department – show how true that is. Those charts, embedded below, show why parsing this pollution dissipation can be tricky.
If you look at averages from the county’s entire network of monitors, nitrogen dioxide emissions are lower than last year’s levels on most days in March, but not all.
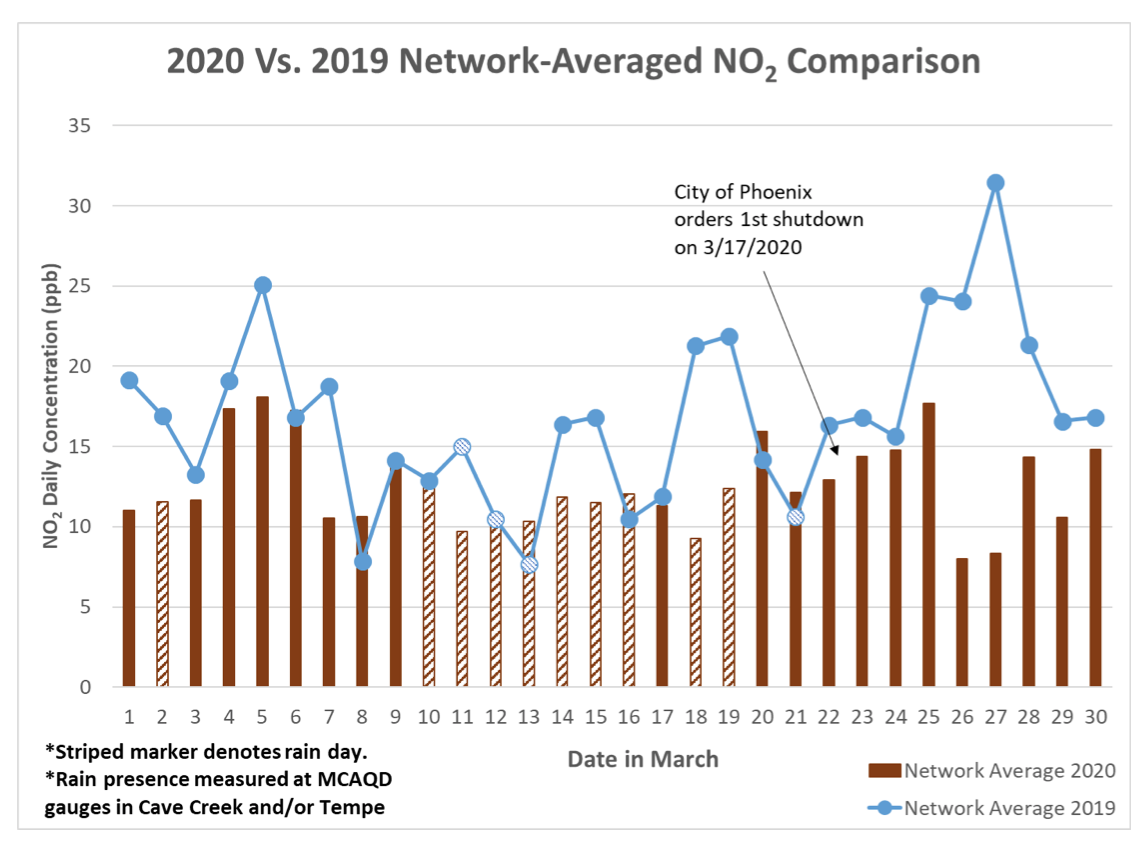
Maricopa County Air Quality Department
But the nitrogen dioxide levels appear substantially lower when compared to a single monitoring site’s four-year average of the pollutant.
That difference is due to many factors, including the fact that nitrogen dioxide levels have been falling over the decades, in large part from more fuel-efficient cars. The downward trend is true both in the Phoenix metro area and across the U.S.
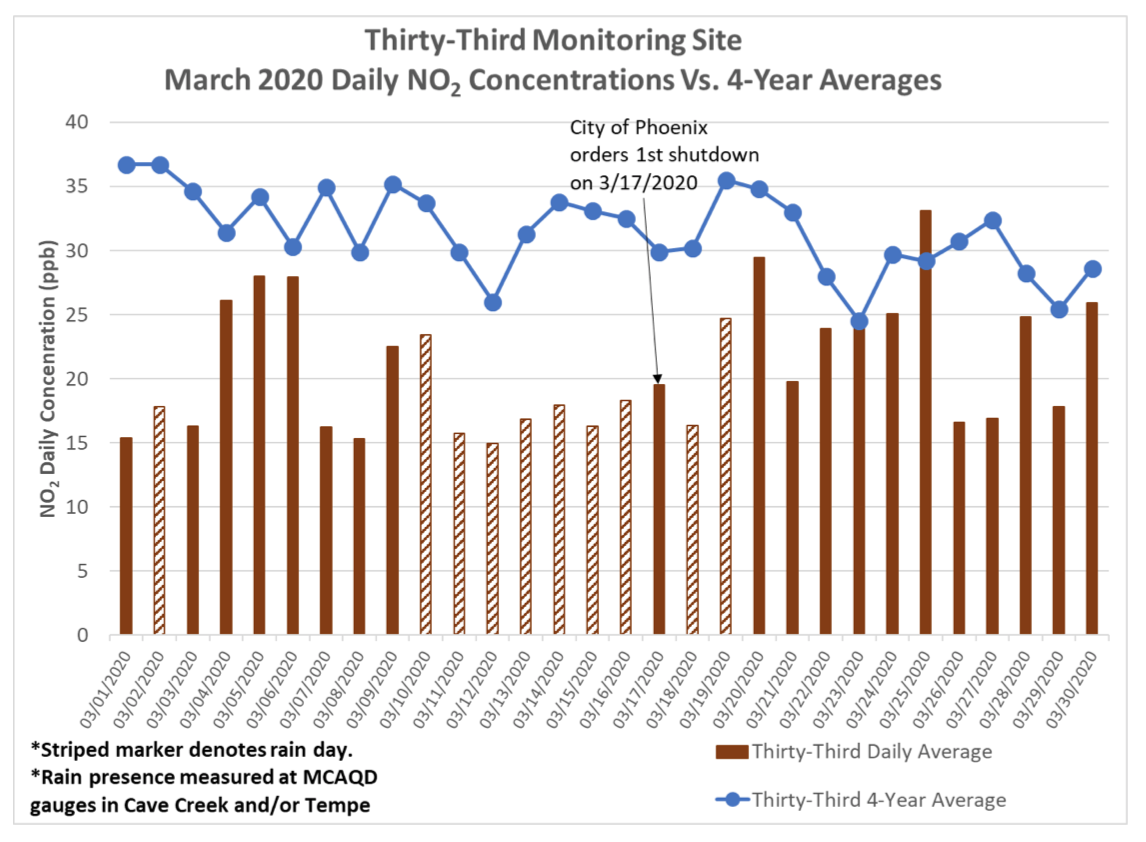
Maricopa County Air Quality Department
Both of these charts show that in the days after Phoenix imposed its first shutdown on March 17, closing bars and restaurants, nitrogen dioxide emissions did not immediately or consistently drop.
“Are we seeing [the effect of the shutdown] in the ambient pollution levels yet?” said Ron Pope, an atmospheric scientist at the Maricopa County Air Quality Department. “Well, it’s in there, but there’s all this other stuff going on.”
For example, March 26 and 27 were windy days, Pope said, and the wind cleared the pollution out.
With fewer cars on the road, it is inevitable that nitrogen dioxide levels would fall, Pope said. But the Valley doesn’t have a serious problem with nitrogen dioxide in the first place, so the reduction wouldn’t be drastic.
He suggested that levels of nitrogen dioxide in the Valley aren’t lower, at this point, because those windy days and the rain in mid-March “already knocked it out.”
Besides the new coronavirus, of course, officials haven’t collected enough data yet to accurately attribute the reductions in nitrogen dioxide, which can float across oceans and political borders and is also affected by wind and rain.
We do know that having fewer cars on the road is helping, since the majority of the nitrogen dioxide in our air comes from vehicles, and people are not driving as much these days. But airplanes, power plants, and machinery play a role too.
“We wouldn’t want somebody to look at that and say, that’s because everybody’s driving less,” said Matt Poppen, senior air quality project manager at the Maricopa Association of Governments. “That’s part of it, but that’s not the whole story.”
According to a 2017 inventory from the Maricopa County Air Quality Department, slightly more than half of nitrogen oxides, a family of pollutants that includes nitrogen dioxide, in the air comes from cars, trucks, and other vehicles; about a third from airplanes, trains, construction and mining equipment, and your lawnmower; and the rest from other sources, including power plants and factories.
How much of the decrease in nitrogen dioxide is because people are driving less? Because construction has slowed, or fewer planes are flying? Could some sources be producing more nitrogen dioxide as others produce less? Has the slowdown in other countries and states – California, Mexico, Asia – contributed to slightly cleaner air here?
“There will be so many things to try to weed through,” Poppen said.
As Pope put it, “How can we tease out the effects of the traffic, versus the weather, versus the concentrations we’re already seeing in the ambient environment?”
MAG also gathered data from the analytics company INRIX, which shows that people are driving faster – not because they’re breaking speed limits, but because with fewer people out, the roads are less congested.
This week, it began publishing those and other data looking at the impacts of the COVID-19 shutdown on traffic throughout the Valley. The graph below compares average speeds from March 2019 and March 2020 – you can see how now, it’s actually possible to approach the speed limit during rush hour.
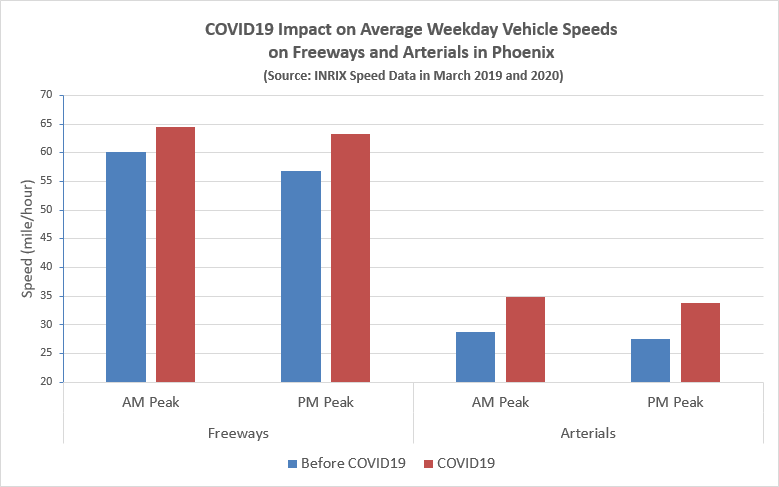
Fewer cars on the road means faster driving.
INRIX
For researchers and air quality experts and modelers, the shutdown presents a beyond-rare opportunity.
“When we do modeling, you can run these tests, you can ask the model, ‘What would happen if we reduced travel by 10 percent? Or if 10 percent of the emissions were removed?'” Poppen said. “And the model would theoretically give you concentrations of ozone based on that.”
“But now,” he added, “we can actually look at what can really happen in this world.”
Pope, with the county air quality department, said that he and others already have begun talking about studies, once they get more data, to study the impact of the shutdown on pollution and air quality.
“It creates an environment where you can get some of those research opportunities,” he said.
So far, ozone levels have not dropped because of the COVID-19 shutdown. But then again, the Valley’s ozone season typically doesn’t begin until April or May. Poppen was hopeful that with less nitrogen dioxide in the air, less polluting ozone will form.
But as summer approaches and the sun intensifies, that could change.
“The chemistry [of ozone formation] is complex. It’s really the ratio between nitrogen dioxide and VOCs that determines how much ozone is available to be created,” he said. “Normally, we would assume that a reduction in nitrogen dioxide would help to reduce ozone levels, but we won’t know until we have some monitor data.”